 GeoData.NZ
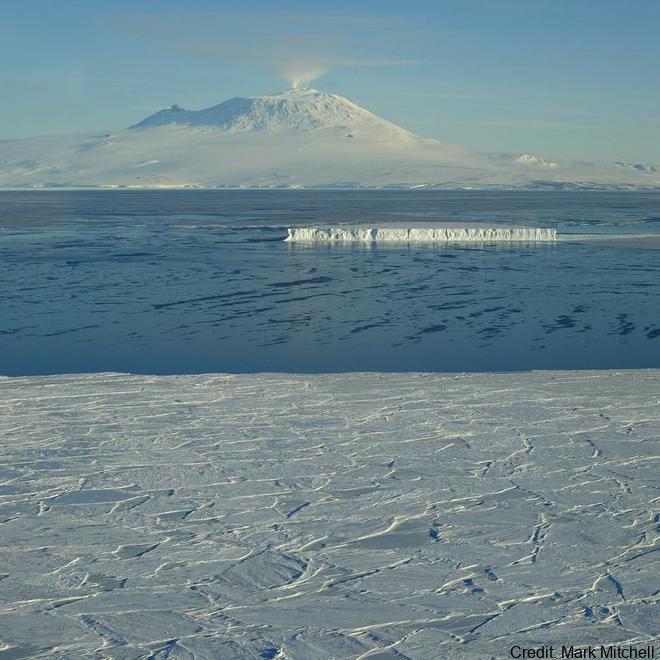
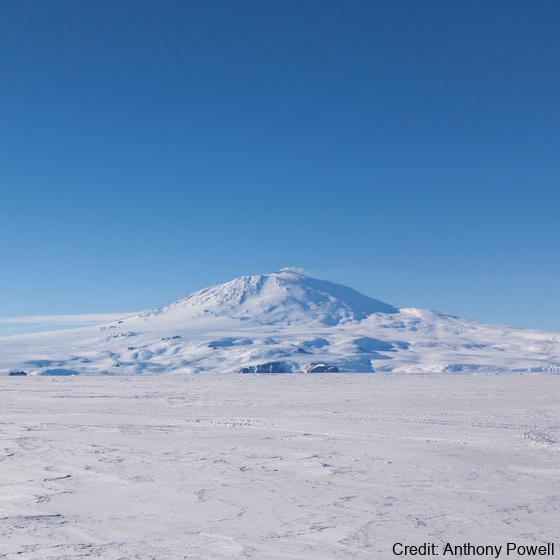
MCMURDO SOUND
Type of resources
Available actions
Topics
Keywords
Contact for the resource
Provided by
Years
Update frequencies
status
-
Sea ice temperature (°C) measured across multiple depths at (LATITUDE: -77.792300, LONGITUDE: 166.514900). Related Publication: Richter ME, Leonard GH, Smith IJ, Langhorne PJ, Mahoney AR, Parry M. Accuracy and precision when deriving sea-ice thickness from thermistor strings: a comparison of methods. Journal of Glaciology. 2023;69(276):879-898. doi:10.1017/jog.2022.108 GET DATA: https://doi.org/10.1594/PANGAEA.880164
-
Sea ice temperature (°C) measured across 11 depths (57 cm, 78.5 cm, 84.5 cm, 87.5 cm, 96.5 cm, 105.5 cm, 108.5 cm, 114.5 cm, 117.5 cm, 120.5 cm, 129.5 cm) at (LATITUDE: -77.781700, LONGITUDE: 166.315300): Related Publication: Richter ME, Leonard GH, Smith IJ, Langhorne PJ, Mahoney AR, Parry M. Accuracy and precision when deriving sea-ice thickness from thermistor strings: a comparison of methods. Journal of Glaciology. 2023;69(276):879-898. doi:10.1017/jog.2022.108
-
Sea ice temperature (°C) measured across multiple depths from 20 cm to 207.5 cm at (latitude: -77.775800, longitude: 166.312800): Related Publication: Richter ME, Leonard GH, Smith IJ, Langhorne PJ, Mahoney AR, Parry M. Accuracy and precision when deriving sea-ice thickness from thermistor strings: a comparison of methods. Journal of Glaciology. 2023;69(276):879-898. doi:10.1017/jog.2022.108
-
Sea ice temperature (°C) measured across multiple depths at (LATITUDE: -77.794900, LONGITUDE: 166.334700). Related Publication: Richter ME, Leonard GH, Smith IJ, Langhorne PJ, Mahoney AR, Parry M. Accuracy and precision when deriving sea-ice thickness from thermistor strings: a comparison of methods. Journal of Glaciology. 2023;69(276):879-898. doi:10.1017/jog.2022.108 GET DATA: https://doi.org/10.1594/PANGAEA.880165
-
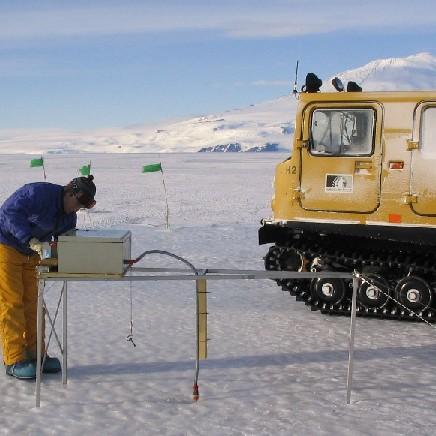
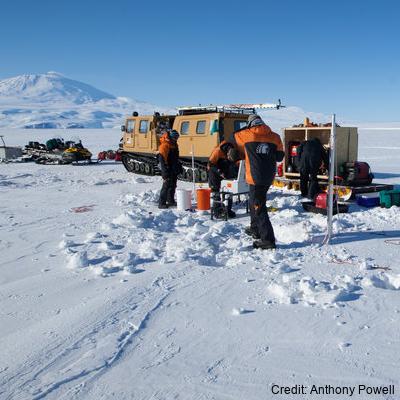
Data provided here have been collected as part of the project "Measurements and Improved Parameterization of the Thermal Conductivity and Heat Flow through First-Year Sea Ice", OPP-0126007* and include measurements of temperature and various ice properties at selected sites in first-year and multiyear sea ice in McMurdo Sound, Antarctica in the years 2002-2004. Data from earlier installations of thermistor chains for measurements of ice temperature carried out by the New Zealand team have also been included. Data files are in Microsoft Excel format, with individual worksheets for specific cores or temperature data sets. Detailed information and comments on data sampling location etc. are provided in the files. Further information on data collection, results etc. can be found in the following publications: Backstrom, L. G. E., and H. Eicken 2007, submitted, Capacitance probe measurements of brine volume and bulk salinity in first-year sea ice, Cold Reg. Sci. Tech. Pringle, D. J., H. Eicken, H. J. Trodahl, and L. G. E. Backstrom 2007, submitted, Thermal conductivity of landfast Antarctic and Arctic sea ice, J. Geophys. Res. Trodahl, H. J., S. O. F. Wilkinson, M. J. McGuinness, and T. G. Haskell 2001, Thermal conductivity of sea ice; dependence on temperature and depth, Geophys. Res. Lett., 28, 1279-1282. Data are in Microsoft Excel format. Abbreviations: AH = Arrival Heights; CH = Camp Haskell (near Delbridge Islands); VUW = Victoria University Wellington; UAF = University Alaska Fairbanks. RELATED PUBLICATION: https://doi.org/10.1017/jog.2022.108 GET DATA: https://drive.google.com/drive/folders/1ooUH9dPvWT66afFC51Cb0JOHg66rn0sy
-

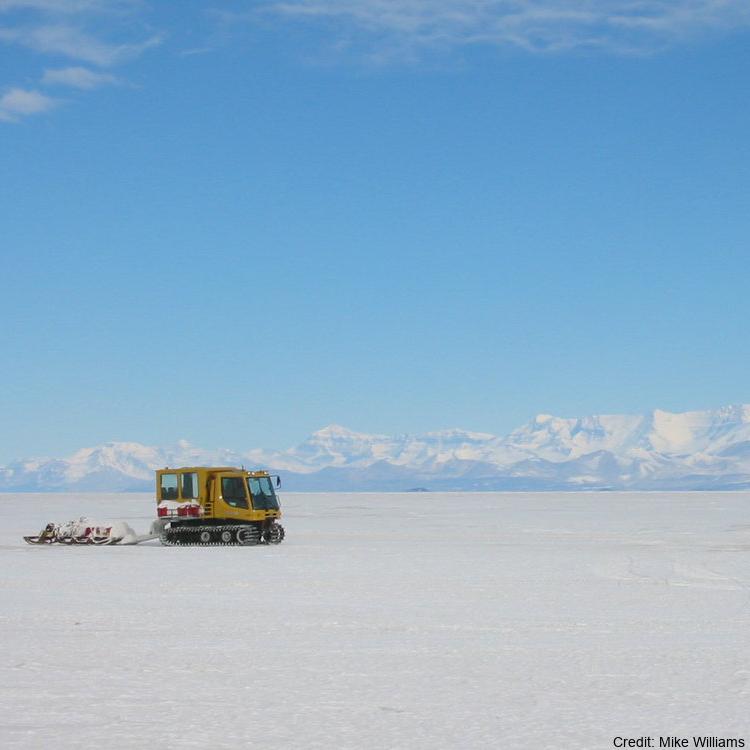
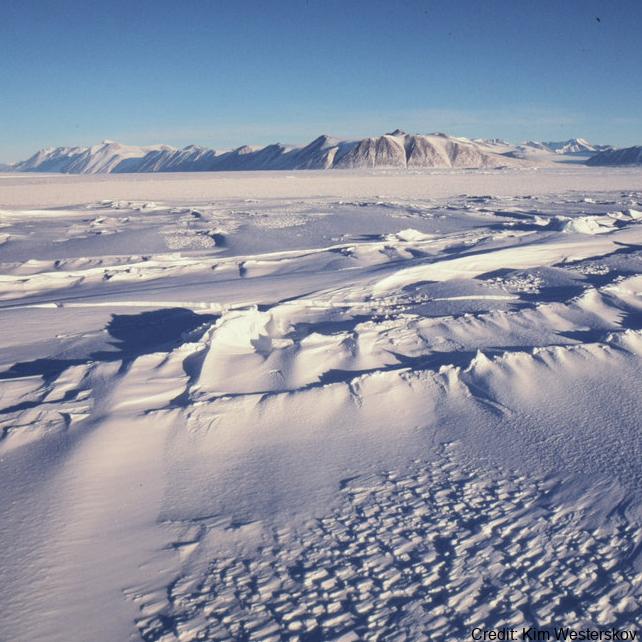
Sea ice thickness and sub-ice platelet layer thickness under fast ice were measured at regular intervals at two North-South oriented profiles and four east-west oriented profiles in McMurdo Sound, Antarctica in November 2013. Holes were drilled at regular intervals into sea ice at measurement sites about 10 km apart. The thickness was measured using measurement tapes. Snow depth on sea ice was also measured at all sites
-
The data are approximately 800 km of airborne electromagnetic survey of coastal sea ice and sub-ice platelet layer (SIPL) thickness distributions in the western Ross Sea, Antarctica, from McMurdo Sound to Cape Adare. Data were collected between 8 and 13 November 2017, within 30 days of the maximum fast ice extent in this region. Approximately 700 km of the transect was over landfast sea ice that had been mechanically attached to the coast for at least 15 days. Most of the ice was first-year sea ice. Unsmoothed in-phase and quadrature components are presented at all locations. Data have been smoothed with an 100 point median filter, and in-phase and quadrature smoothed data are also presented at all locations. Beneath level ice it is possible to identify the thickness of an SIPL and a filter is described (Langhorne et al) to identify level ice. Level ice in-phase, quadrature and SIPL thickness, derived from these, are presented at locations of level ice. For rough ice, the in-phase component is considered the best measure of sea ice thickness. For level ice where there is the possibility of an SIPL, then the quadrature component is considered the best measure of ice thickness, along with SIPL thickness. All data are in meters.
-
Here, we present drill hole measurements carried out at 14 field sites distributed over a ~1500 km^2 area of fast ice in the south of McMurdo Sound, Antarctica between 1 and 19 November 2018. At each site, five holes were drilled in the fast ice at the centre and end points of two cross‐profile lines, each 30 metre long. Sea ice and SIPL thicknesses were measured with a suspended thickness probe and metal bar using the procedure described in Price et al. (2014). Snow depth measurements at centimetre accuracy were made at half‐metre intervals along the cross‐profiles using a metal ruler or a GPS‐equipped Magnaprobe. Sea ice freeboard (i.e., the height of the sea ice surface above sea level) was measured in each of the drill holes. The average value for each parameter was calculated at each field site to provide a representative measurement over the 30 metre cross-profile fast ice area. The drill hole measurements were used to underpin spatial distribution surveys of the aforementioned parameters, to inform electromagnetic induction forward and inverse models, and to ground-validate satellite altimetry assessments of fast ice freeboard and derived ice thickness in McMurdo Sound.
-

The thicknesses of sea ice and sub-ice platelet layer were measured at regular intervals on fast ice in McMurdo Sound, Antarctica in November of 2017. Thirty-metre cross-profiles were established at each site, and snow depths were measured at 0.5 m intervals along the transect lines with a MagnaProbe. A mean snow depth for each site was derived from these 120 measurements. Freeboard, sea ice thickness and sub-ice platelet layer thickness were recorded at five locations at each site - at the central crossing point and at the end points of each transect. The mean of these was then calculated and taken as representative of the site. Ice thicknesses were measured by using a tape measure with a brass T-anchor attached at the zero mark. This was deployed vertically through the drill-hole and allowed to rotate to a horizontal alignment when exiting the bottom of the drill-hole at the ice-ocean interface. From this position the anchor is slowly pulled upwards until some resistance is met and the first measurement is taken. This resistance is taken to mark the sub-ice platelet layer/ocean interface. The tape measure is then pulled harder, forcing the bar to pass through the sub-ice platelet layer until it sits flush against the sea ice/sub-ice platelet layer interface where a second measurement is taken. Measurement sites were about 10 km apart.
-

The data set contains sea ice thickness (consolidated ice plus snow) of pack ice in the Western Ross Sea acquired by fixed wing aircraft (BT-67 C-GJKB) between McMurdo Sound (77.68 S / 165.52E) and near Cape Adare (72.01 S / 171.53 E). Two survey profiles are oriented South - North near parallel and about 100km off the Victoria Land coast, and two survey profiles are leading into Terra Nova Bay oriented in East –West direction at around 74.5 S and 75 S. The total length of the survey profiles is about 800 km. The Southern survey was flown from 9 November 2017 22:19 UTC to 10 November 2017 00:25 UTC beginning in McMurdo Sound and went for 300 km to the north, before turning west into Terra Nova Bay for another 100 km. The Northern survey was flown on 11 November 2017 from 1:21 UTC to 3:04 UTC from near the Adare Peninsula in a southerly direction for 215 km before turning southwest towards Cape Washington for another 140 km. The airborne electromagnetic induction (AEM) ice thickness sensor was towed by a Basler BT-67 aircraft sampling thickness every 6m along the flight track. The accuracy of the measured ice thickness is +/-0.1m over level ice. Ice thicknesses are biased up to 50% low for pressure ridges smaller than the signal footprint of about 45 m. Data was collected with the support of Antarctica New Zealand (event K066-1718-A; 25/10/2017-28/11/2017) for the New Zealand National Science Challenge Deep South (Targeted observation and process informed modelling of Antarctic sea ice, PI P. Langhorne). The purpose of data collection was to gain a basic understanding of sea ice thickness close to the areas of the Ross Sea, McMurdo, and Terra Nova Bay Polynyas.